6.15 taylor plot
Note
Click here to download the full example code or to run this example in your browser via Binder
6.15 taylor plot#
import numpy as np
from easy_mpl import taylor_plot
from easy_mpl.utils import version_info

version_info()

# sphinx_gallery_thumbnail_number = -1
{'easy_mpl': '0.21.4', 'matplotlib': '3.8.4', 'numpy': '1.26.4', 'pandas': '1.5.3', 'scipy': '1.13.1'}
# The desired covariance matrix.
cov = np.array(
[[1, 0.8, 0.6, 0.4, 0.2],
[0.8, 1.2, 0.8, 0.6, 0.4],
[0.6, 0.8, 0.8, 0.8, 0.6],
[0.4, 0.6, 0.8, 1.4, 0.8],
[0.2, 0.4, 0.6, 0.8, 0.6]]
)
# Generate the random samples.
rng = np.random.default_rng(313)
data = rng.multivariate_normal(np.zeros(5), cov, size=100)
print(data.shape)
observations = data[:, 0]
simulations = {"LSTM": data[:, 1],
"CNN": data[:, 2],
"TCN": data[:, 3],
"CNN-LSTM": data[:, 4]}
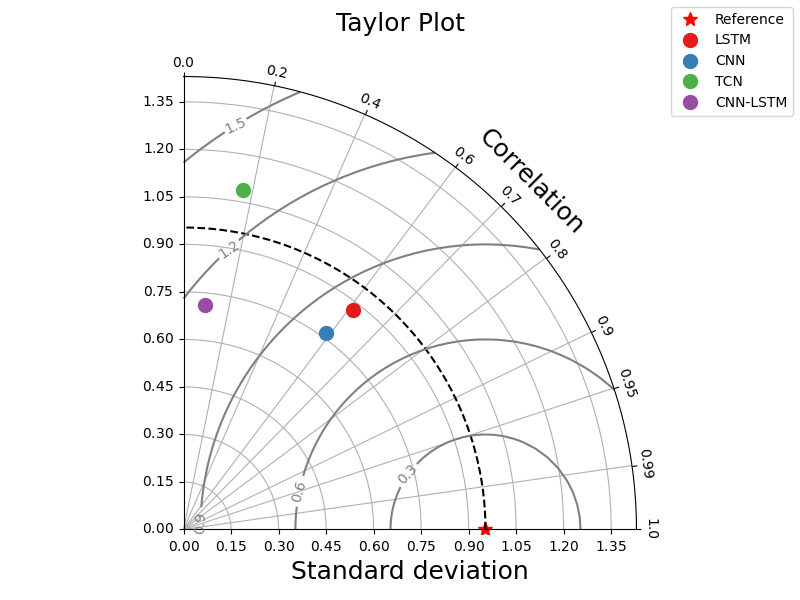
_ = taylor_plot(observations=observations,
simulations=simulations,
title="Taylor Plot")
/home/docs/checkouts/readthedocs.org/user_builds/python-seekho/checkouts/latest/scripts/plotting/_taylor.py:29: RuntimeWarning: covariance is not symmetric positive-semidefinite.
  data = rng.multivariate_normal(np.zeros(5), cov, size=100)
(100, 5)
multiple taylor plots in one figure
def create_data(cov, seed=313, mu=np.zeros(5), size=100):

    # Generate the random samples.
    rng = np.random.default_rng(seed)

    return rng.multivariate_normal(np.zeros(5), cov, size=size)

cov1 = np.array(
    [[1,  0.8, 0.6, 0.4, 0.2],
    [0.8, 1.2, 0.8, 0.6, 0.4],
    [0.6, 0.8, 0.8, 0.8, 0.6],
    [0.4, 0.6, 0.8, 1.4, 0.8],
    [0.2, 0.4, 0.6, 0.8, 0.6]]
)

cov2 = np.array(
    [[1,  0.8, 0.6, 0.4, 0.2],
    [0.8, 1.2, 0.8, 0.6, 0.4],
    [0.6, 0.8, 0.8, 0.8, 0.6],
    [0.4, 0.6, 0.8, 1.4, 0.8],
    [0.2, 0.4, 0.6, 0.8, 0.6]]
)

cov3 = np.array(
    [[1,  0.8, 0.6, 0.4, 0.2],
    [0.8, 1.2, 0.8, 0.6, 0.4],
    [0.6, 0.8, 0.8, 0.8, 0.6],
    [0.4, 0.6, 0.8, 1.4, 0.8],
    [0.2, 0.4, 0.6, 0.8, 0.6]]
)

cov4 = np.array(
    [[1,  0.8, 0.6, 0.4, 0.2],
    [0.8, 1.2, 0.8, 0.6, 0.4],
    [0.6, 0.8, 0.8, 0.8, 0.6],
    [0.4, 0.6, 0.8, 1.4, 0.8],
    [0.2, 0.4, 0.6, 0.8, 0.6]]
)

site1_data = create_data(cov1)
site2_data = create_data(cov2)
site3_data = create_data(cov3)
site4_data = create_data(cov4)

observations = {
    'site1': site1_data[:, 0],
    'site2': site2_data[:, 0],
    'site3': site3_data[:, 0],
    'site4': site4_data[:, 0],
}

simulations = {
    "site1": {"LSTM": site1_data[:, 1],
                "CNN": site1_data[:, 2],
                "TCN": site1_data[:, 3],
                "CNN-LSTM": site1_data[:, 4]},

    "site2": {"LSTM": site2_data[:, 1],
                "CNN": site2_data[:, 2],
                "TCN": site2_data[:, 3],
                "CNN-LSTM": site2_data[:, 4]},

    "site3": {"LSTM": site3_data[:, 1],
                "CNN": site3_data[:, 2],
                "TCN": site3_data[:, 3],
                "CNN-LSTM": site3_data[:, 4]},

    "site4": {"LSTM": site4_data[:, 1],
                "CNN": site4_data[:, 2],
                "TCN": site4_data[:, 3],
                "CNN-LSTM": site4_data[:, 4]},
}

# define positions of subplots

rects = dict(site1=221, site2=222, site3=223, site4=224)

_ = taylor_plot(observations=observations,
            simulations=simulations,
            axis_locs=rects,
            plot_bias=True,
            cont_kws={'colors': 'blue', 'linewidths': 1.0, 'linestyles': 'dotted'},
            grid_kws={'axis': 'x', 'color': 'g', 'lw': 1.0},
            title="mutiple subplots")

/home/docs/checkouts/readthedocs.org/user_builds/python-seekho/checkouts/latest/scripts/plotting/_taylor.py:49: RuntimeWarning: covariance is not symmetric positive-semidefinite.
  return rng.multivariate_normal(np.zeros(5), cov, size=size)
using statistics instead of arrays
observations = {'std': 3.5}
predictions = {   # pbias is optional
        'Model 1': {'std': 2.80068, 'corr_coeff': 0.49172, 'pbias': -8.85},
        'Model 2': {'std': 3.8, 'corr_coeff': 0.67, 'pbias': -19.76},
        'Model 3': {'std': 3.9, 'corr_coeff': 0.596, 'pbias': 7.81},
        'Model 4': {'std': 2.36, 'corr_coeff': 0.27, 'pbias': -22.78},
        'Model 5': {'std': 2.97, 'corr_coeff': 0.452, 'pbias': -7.99}}


_ = taylor_plot(observations,
    predictions)

with customized markers
cov = np.array(
[[1, 0.8, 0.6, 0.4, 0.2],
[0.8, 1.2, 0.8, 0.6, 0.4],
[0.6, 0.8, 0.8, 0.8, 0.6],
[0.4, 0.6, 0.8, 1.4, 0.8],
[0.2, 0.4, 0.6, 0.8, 0.6]]
)
data = create_data(cov)
observations = data[:, 0]
simulations = {"LSTM": data[:, 1],
"CNN": data[:, 2],
"TCN": data[:, 3],
"CNN-LSTM": data[:, 4]}
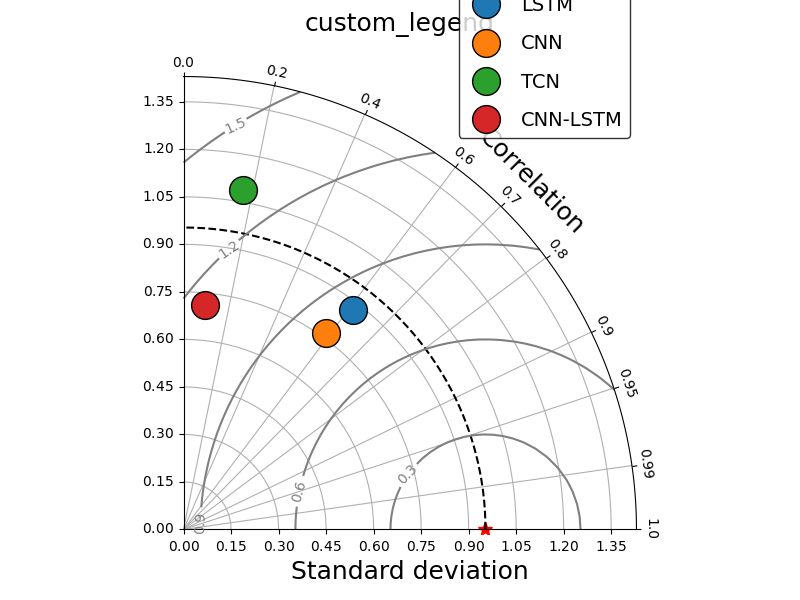
_ = taylor_plot(observations=observations,
simulations=simulations,
marker_kws={'markersize': 10, 'markeredgewidth': 1.5,
'markeredgecolor': 'black', 'lw': 0.0})

/home/docs/checkouts/readthedocs.org/user_builds/python-seekho/checkouts/latest/scripts/plotting/_taylor.py:49: RuntimeWarning: covariance is not symmetric positive-semidefinite.
  return rng.multivariate_normal(np.zeros(5), cov, size=size)
with customizing bbox
_ = taylor_plot(observations=observations,
            simulations=simulations,
            title="custom_legend",
            leg_kws={'facecolor': 'white',
                'edgecolor': 'black','bbox_to_anchor':(0.80, 1.1),
                'fontsize': 14, 'labelspacing': 1.0},
                marker_kws = {'ms':'20', 'markeredgecolor': 'k', 'lw': 0.0},
                )
Total running time of the script: ( 0 minutes 3.348 seconds)