6.17 violin
Note
Click here to download the full example code or to run this example in your browser via Binder
6.17 violin#
This file shows the usage of violin_plot() function.
import numpy as np
import pandas as pd
import matplotlib.pyplot as plt

from easy_mpl import violin_plot
from easy_mpl.utils import _rescale
from easy_mpl.utils import version_info

version_info()
{'easy_mpl': '0.21.4', 'matplotlib': '3.8.4', 'numpy': '1.26.4', 'pandas': '1.5.3', 'scipy': '1.13.1'}
The basic violin plot can be drawn by passing a pandas DataFrame with one or more columns.

The function :func:`violin_plot always returns a matplotlib axes object.
If we set show to False then, the returned axes can be used for further manipulation.

The value of cut determines the length of tails on both sides.

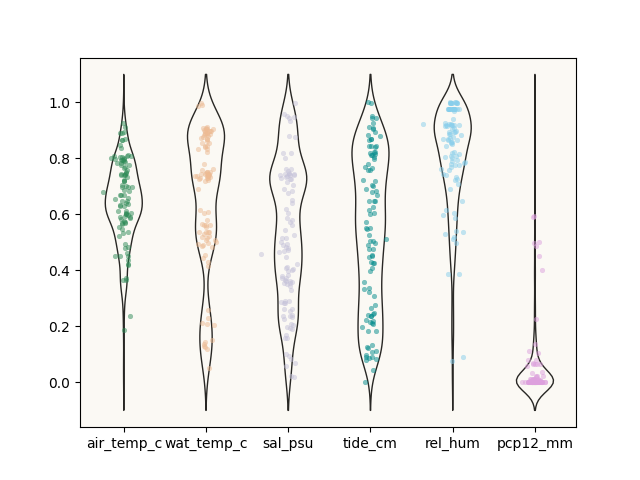
We can specify colors for each of the violin plot separately. It can be any valid matplotlib colors i.e., name of color as string or its RGB vlaue.
axes = violin_plot(
    df[cols], show=False, cut=0.1, fill=False,
    scatter_kws={"s": 12, 'alpha': 0.5, 'edgecolors': None, 'linewidths': 0.2},
    datapoints_colors=['seagreen',
                       np.array([237, 187, 147]) / 255,
                      np.array([197, 194, 218]) / 255,
                      'darkcyan',
                      'skyblue',
                      "plum",
                       ]
                   )
axes.set_facecolor("#fbf9f4")
plt.show()
Total running time of the script: ( 0 minutes 1.468 seconds)